
Server Monitoring for Apple Watch
See monitoring dashboards, receive server downtime notifications and view real-time reports on Apple Watch and iPhone.
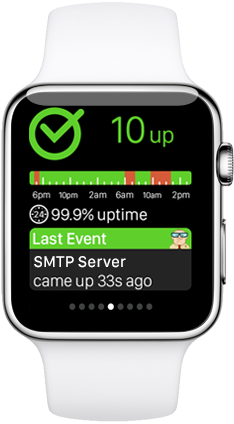
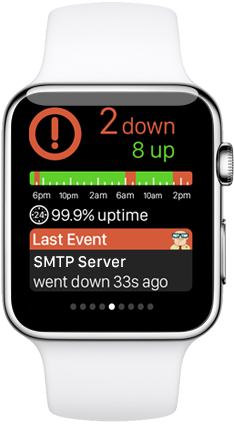
Dashboards at a Glance
Glancing at your Apple Watch will display the ITmanager.net monitoring dashboard. Quickly see the overall health of your servers, downtime statistics over the last 24 hours, and the last monitoring event to be triggered.
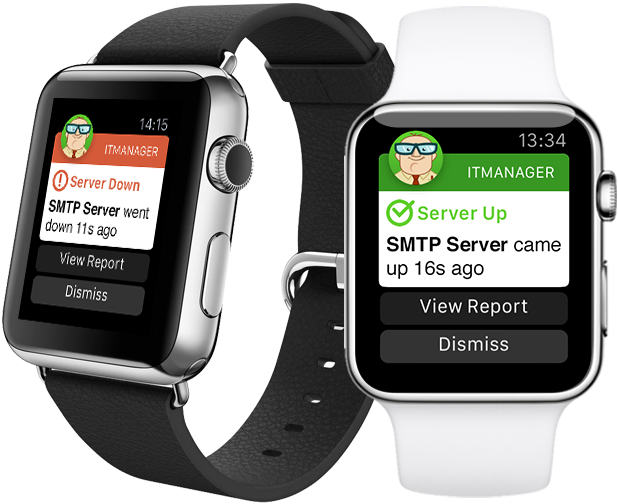
Instant Downtime Alerts
Get real-time alerts when your network or servers go down or come back up. Dismiss the alert, or request more details directly from your Apple Watch.

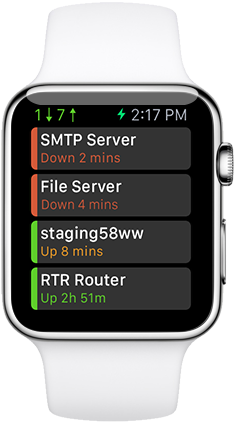
ITmanager.net app for Apple Watch
When you start the ITmanager.net Apple Watch app, you will see a scrollable list of your servers and their current status. Tapping on one of the servers opens the report screen for more detailed server performance information.
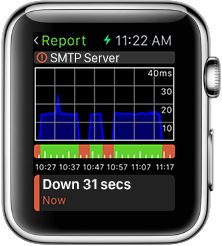
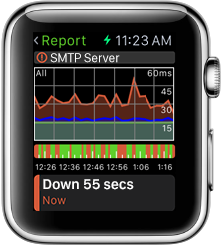
Report Screen
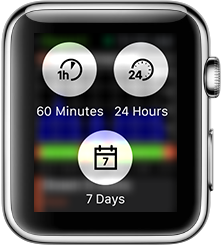
See a graph of the average response time of the server as well as a scrollable list of Monitoring Events. Force touch on the screen to change the report period or tap on the graph to change from Minimum, Maximum and Average response time graphs.
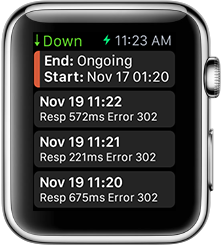
Event Screen
Tapping on a monitoring event opens the Monitoring Event Screen allowing you to diagnose the cause of the downtime. Use the ITmanager.net iPhone App to resolve the problem by creating a remote connection to the server.
Servers Down? Not on my watch.